

Turn the data on your machines into decisions that improve the line.
Brilliant Operations work centers on MES manufacturing software, with the historians and dashboards built around it. Every project starts from the data your plant is already collecting, and it ends with accurate counts, quality results, and insights operators can act on.
What Brilliant Operations covers
Brilliant Operations picks up where your control system leaves off. Once data leaves the PLC, we put it to work across manufacturing operations management (MOM): running orders, tracking quality and genealogy, measuring OEE, and surfacing patterns your teams can’t see on their own. Here’s what we offer:
Manufacturing execution system (MES)
ERP integration, order execution, quality, genealogy, and OEE
Historian and data infrastructure
New historian installs and migrations
Reporting and visualization
KPIs, dashboards, reports, and SCADA screens built to report rather than run a process
Advanced analytics and AI
Machine learning, anomaly detection, and predictive models built on your plant data
We know where your data comes from
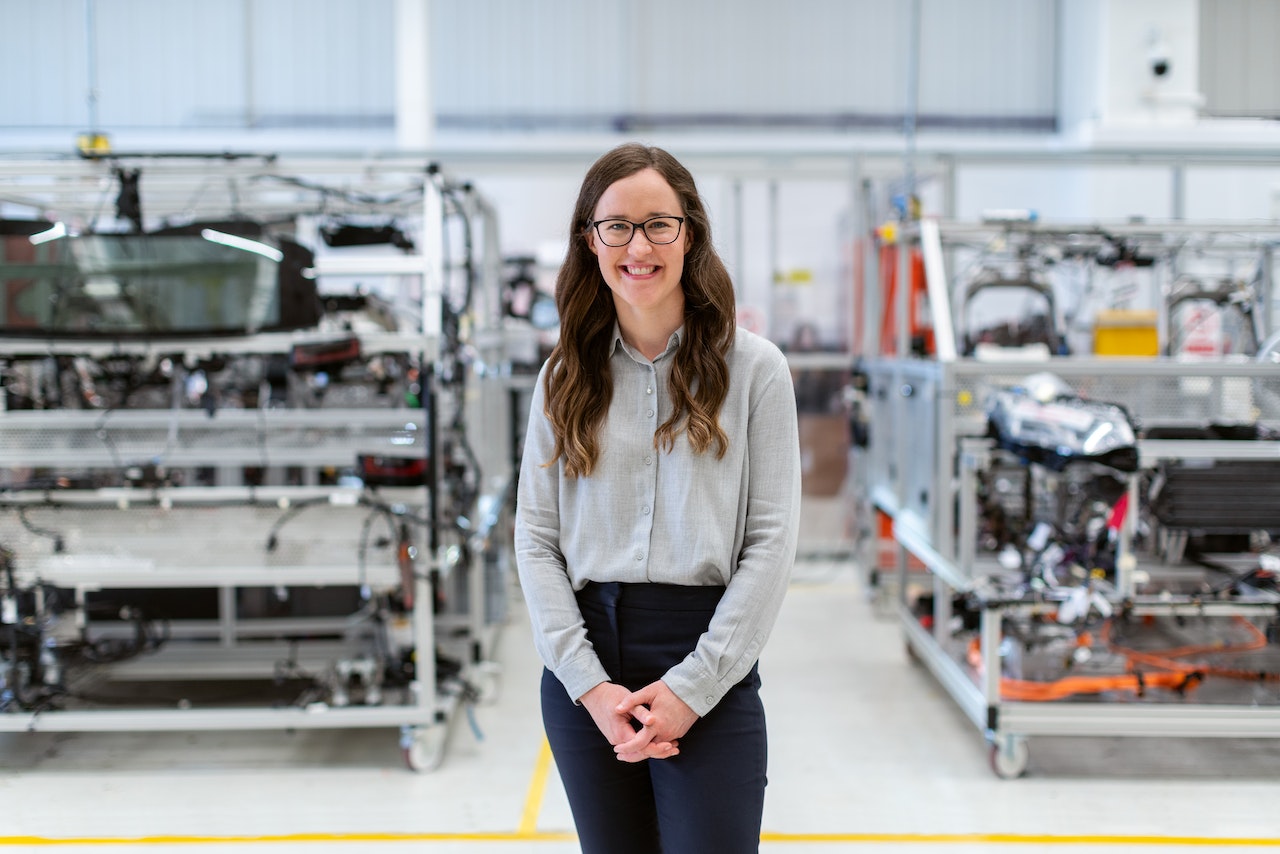
Too many data projects are built by people who have never stood on the plant floor. The result is dashboards nobody uses and models that miss what operators already know. GrayMatter has spent decades inside industrial operations, from the control systems where data starts to the strategy that decides what it’s for. That perspective shapes every Brilliant Operations project, whether it’s a single dashboard or a plant-wide MES. With a technology agnostic approach, we put data to work in a way that works for you.

Built for companies with more than one site
Most of the companies we work with run sites at different stages. One plant is on paper. Another has a historian nobody trusts. A third runs an MES that hasn’t been upgraded in years. That mix is where we start. We agree on one definition of downtime, one set of units, and one way to calculate OEE, so every site speaks the same data, then bring each site up to that standard at its own pace. Comparing plants stops being a spreadsheet exercise.
Find where your sites sit, and that’s where we’ll start.
Talk with a Factory Advisor-
PRE-DIGITAL, SITE LEVEL
Analytics — Paper and spreadsheets.
MES — Downtime and scrap logged by hand, quality checked manually.
Data — Basic trending, no site Ethernet. -
STAGE 1, SITE LEVEL
Analytics — Past and present, descriptive, with SPC and first principles.
MES — Digitized downtime and OEE.
Data — A site historian with limited history, on a plant network. -
STAGE 2, DIVISION OR REGION
Analytics — Past and present, diagnostic, with regression and anomaly analysis.
MES — Automated OEE and system-based quality.
Data — A site historian with a year of history, and quality samples recorded at entry. -
STAGE 3, COMPANY-WIDE
Analytics — Present and prescriptive, with CMMS integration.
MES — Automated quality.
Data — A central historian with years of history, cloud access, and a company network. -
STAGE 4, COMPANY-WIDE
Analytics — Predictive, with machine learning that assists the operator.
MES — Scheduling and genealogy.
Data — A cloud historian on a company network tied to the cloud. -
STAGE 5, COMPANY-WIDE
Analytics — Predictive.
MES — Full integration between the MES and the ERP.
Data — A cloud data lake with every site tied to it.
Brilliant Operations across industries
Manufacturing intelligence looks different in every industry. The job is the same: the right number, in front of the right person, in time to act.
Food and Beverage
Predictive quality
Check-weighers, cryovacs, kitchen systems, and historians already hold the data that explains giveaways and scrap. GrayMatter connects it, and at one food manufacturer operators now get an hour or more of warning before a quality measure drifts out of spec.
Discrete Manufacturing
OEE across sites
When one plant counts pounds and another counts pieces, nobody can compare them. GrayMatter’s OEE solutions standardize how every plant measures output and downtime, so a win at one facility becomes a standard across all of them.
Specialty Chemical
Downtime tracking
GrayMatter starts downtime tracking and analytics on the machines causing the most disruption, then extends it to the rest of the plant’s assets as the first phase proves out. Wireless data collectors pull the data off legacy equipment.
Consumer Goods
Loss visibility
GrayMatter connects what your check-weighers, fillers, and packaging equipment already record into one picture of production, from raw materials through packaging. Small losses show up and can be fixed.
Oil and Gas
Predictive maintenance
GrayMatter applies machine learning models to existing SCADA data to predict equipment failure, in some cases with up to two hours’ advance warning. The same model extends from a handful of pumps or wells to the rest of the field.
Water and Wastewater
Predictive monitoring
GrayMatter’s predictive monitoring combines weather and system data to flag emerging conditions before they become compliance events. Field teams get time to redirect flow instead of reacting to it.
Four ways to engage

Embedded engineers.
Best when your team is stretched and the software work is the bottleneck. Our MES engineers work alongside your people so they can stay on your product.

Upgrades and modernization.
Best when you already run an MES or historian and it is falling behind. We bring it to current versions to reduce risk and put the latest features in your operators’ hands.

OEE Quickstart.
Best when you need proof before you commit. One or two lines, 3 to 10 machines, downtime monitoring, 6 to 8 weeks from start to finish.
Turnkey MES implementation.
Best when you are starting or replacing. Seven stages: discovery, design, configuration, testing, training, go-live, and continued support.
Brilliant Operations by the numbers
Since 2003
Velotic partner.
Largest
Velotic channel partner worldwide.
2025
Velotic Channel Partner of the Year.
~2,400
client accounts as partner of record.
180 +
engineers on the platform.
Better data. Better pizza. Brilliant Ops.
Client goal: Replace paper-based quality checks with quality management that runs in the cloud, built with Velotic. Outcome: Remote access to plant data, less waste and downtime, stronger quality assurance, and a foundation that scales.

Which plant has the most on the line?
We’ll start there. Bring the line that breaks down most often, or the data that no one trusts. Whatever your challenge, talk it through with a GrayMatter engineer that’s seen and solved it before.
Talk with a Factory AdvisorBrilliant Operations: Doing more with data
Every stop and every reject is already recorded somewhere in your PLCs and your historian. Most of it never reaches the person who could have prevented the next one. We connect MES, historian and SCADA so the cause shows up on the floor while there’s still time to act. That’s what doing more with data looks like in practice, and what Industry 4.0 looks like on the floor.

FAQs
It is GrayMatter’s practice for turning plant data into decisions. It covers MES, historian work, dashboards and reports, and machine learning and anomaly detection, and it starts where data leaves the control system.
The historian stores time-stamped process data from your control systems. The MES uses it to manage orders, quality checks, track and trace, and OEE. Most plants need both.
Yes. Upgrades and modernization exist for that, bringing a system to current versions to reduce risk.
Start with one line at one plant. The design is meant to carry to the next site, and multi-site work begins by standardizing definitions so plants can be compared.
They sort losses into downtime, quality, and performance, and capture downtime by hand or automatically, so each loss has a cause attached.
What went into each lot and where it went: raw materials received, their conversion to work in progress, and that work traced to finished goods, with a birth history record for each lot. A trace becomes a lookup.
They apply traditional statistical process control (SPC) rules to a measurement over time, so a trend gets flagged before it produces a bad part.


